Welcome to the AEC Business Analytics Blog
A series of articles covering various data analytics topics, software tools, how it all works and how the tools can improve insights into firm management and building asset management. (Latest posts are on top of the list).

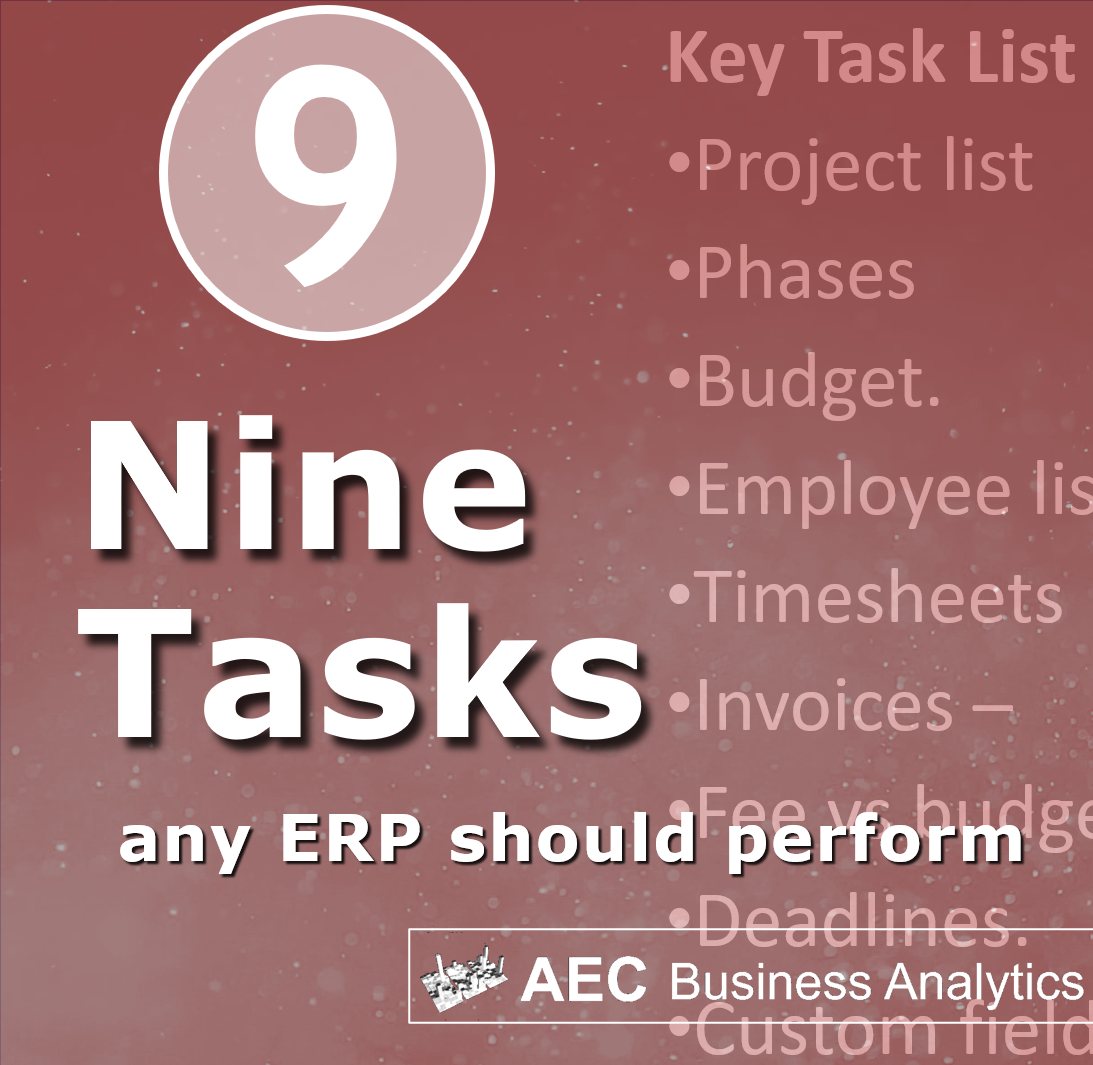
Beyond KPIs: 9 Tasks for Better Operations
The 9 Tasks any ERP should perform to create solid operations.

A Place called Something
Somewhere between “Everything” and “Nothing” is “A Place called Something”. Read on.

Retooling, not Retiring
In my latest blog post I reflect on a realization as I gradually step back from my previous duties. Enrolling in a machine-learning course to enhance my data analytic skills allowed me to chart a whole new course - retooling.

The Milestone Bubble Schedule
Every now and then, I remember why I wanted to learn data analytics - to visualize processes that can be otherwise difficult to see.

3 Ways to Create Project Budgets
Creating budgets is an essential step in setting up performance tracking for design projects. There are (at least) three levels to create effective budgets.

One simple first step to get started with Business Analytics
What is the first step to get started with analytics for your own organization? It’s surprisingly simple: make a list of projects, or whatever your data tracks. The secret is to maintain it.