What is AEC Business Analytics?
The Growing Power of Data Analytics
Over the past decade, data analytics have grown in power as a tool to clearly discern what’s going on in an organization. Advanced data processes – once only available to large companies with a full data team– have become much more accessible to smaller firms through newer software like Tableau and Power BI, and are now available to any firm interested in data analytics.
Capital Expenditures for a large campus distributed over time for budgeting
Data analytics is increasingly valuable because it allows business leadership to connect the threads of often disconnected operations processes so they can be visualized and aggregated. The key goal of this blog is to highlight and share my thoughts and experiences around the emerging power of these data tools to manage firm operations, and also their potential for building projects.
What is Analytics?
For those unaccustomed to data terminology, ‘analytics’ is simply a set of processes that allows an organization to gain insights into its myriad activities. Amazon’s website provides a good working definition:
“Data analytics converts raw data into actionable insights. It includes a range of tools, technologies, and processes used to find trends and solve problems by using data. Data analytics can shape business processes, improve decision-making, and foster business growth.”
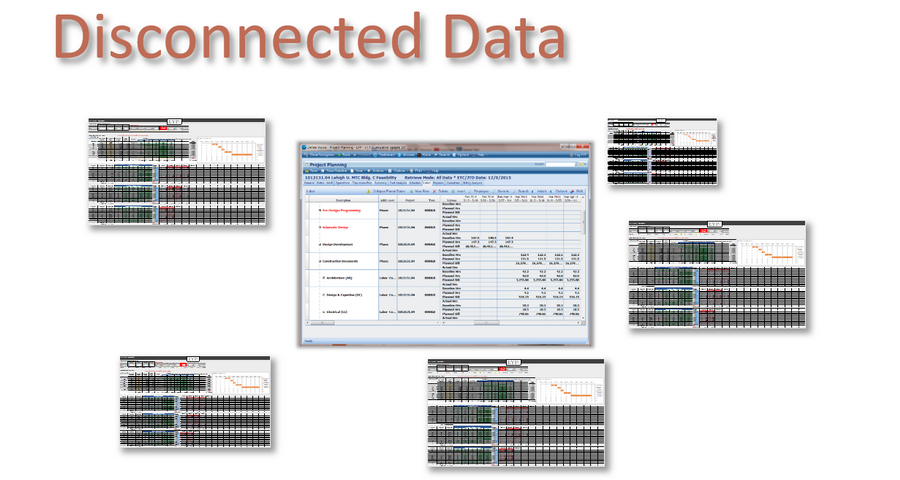
Many users have an ERP they have invested in, but somehow still have multiple Excel sheets that track data in a disconnected way
My fascination with analytics began about a decade ago, looking for a better way to aggregate and track operations at a medium sized A/E firm. The operations system I encountered was mainly Excel-based and seriously fragmented, with multiple spreadsheets tracking a variety of disconnected business processes – project opportunities, individual workplans, revenue projections and more. Given the size of the firm, and the number of projects and personnel, it became clear that we needed to develop a more robust data process.
My first attempt at connecting everything began with using Excel pivot tables to aggregate and track the myriad design projects we had entered in our ERP. With pivot tables, we began to see both the big picture and the underlying detail with a few simple techniques – a lot more rapidly than generating static reports from our central ERP database. Excel was a tool where we could view the detail in a list, but then rapidly aggregate, filter and group the same data in various ways on the fly to see trends or overarching totals.
Pretty soon however, the data we were tracking grew to a complexity where it was straining traditional Excel, and that’s when the search for more powerful data tools began. I began to understand that running a firm’s operations is a “big data” “issue and searched for new, more powerful solutions to better aggregate the data.
Around 2016, I discovered the newly-released Power BI software from Microsoft, a major advance in self-managed analysis and aggregation. Where Excel spreadsheets were limited to about a million rows of data, Power BI could handle millions or billions of lines. Another key component of Power BI’s analytics was that it was on-screen interactive, allowing the viewer to click on one visual to filter and drill down into data on other visuals.
Pivot Tables in Excel (left) evolved to Power BI dashboards (right) for more advanced and interactive aggregations.
With these improvements, I began to comprehend how large data sets could be manipulated to generate true insights: trends were easier to identify than with just tabular data. Pretty soon I was hooked on the power to gain insights from data techniques and I have continued with Power BI ever since, which is what prompted me to blog about it.
What I Hope Readers will See.
The goal of this blog then is to highlight the many processes, tools and lessons learned that I have used over the years to build enterprise data solutions. Data analytics can be a broad topic with a dizzying array of uses for organizations, but I’m focused on a narrow subset of what business analytics for the AEC industry means, including project management, firmwide metrics and building asset information.
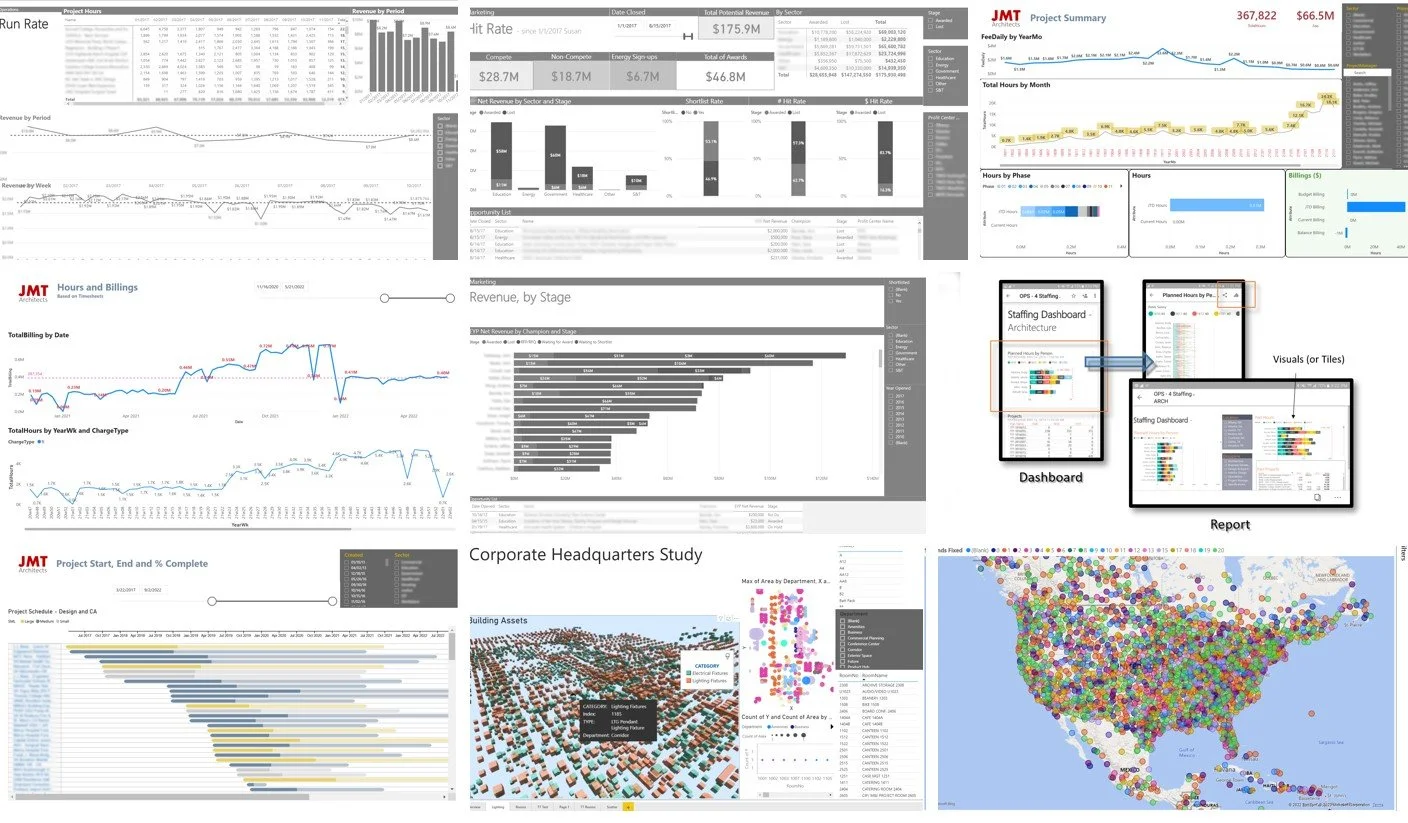
The image above shows many of the visualizations I have produced over the years. Some are related to projects and revenue, others are about marketing wins and timesheets. Others still are related to buildings and even for fun, UFO sightings.
I will probably ease into the topic of data analytics with posts that assume that readers are primarily new to the world of data. But I am looking forward to posting later about some of the more advanced data techniques I have found useful. My hope is that the blog will appeal to new users contemplating using data, and also more experienced users, to highlight software you may not have previously paid much attention to.
“If there is a central theme to this website it is that building successful data systems requires an understanding that data is an ecosystem.“
The articles will have a dual focus - basic operational data, and data techniques for managing building assets and facilities. A lot of posts will center around specific tools that can be used for various pieces of the data continuum. The majority of the early articles will deal with operations data techniques, but I think there is a lot of unexplored potential for data analytics applied to buildings.
If there is a central theme to this website it is that building successful data systems requires an understanding that data is an ecosystem. What I mean by this is that no single tool handles all aspects of data the best, rather there are different tools that work best for different stages of the data continuum.
This is probably the biggest pitfall I see of firms who are trying to create their data solution, and its why I made Data Is an Ecosystem my first content post. Just understanding that there are other tools you can use along with your central database is a key breakthrough in creating an optimized data system.
That’s the goal. Now let’s get on with the content.


